


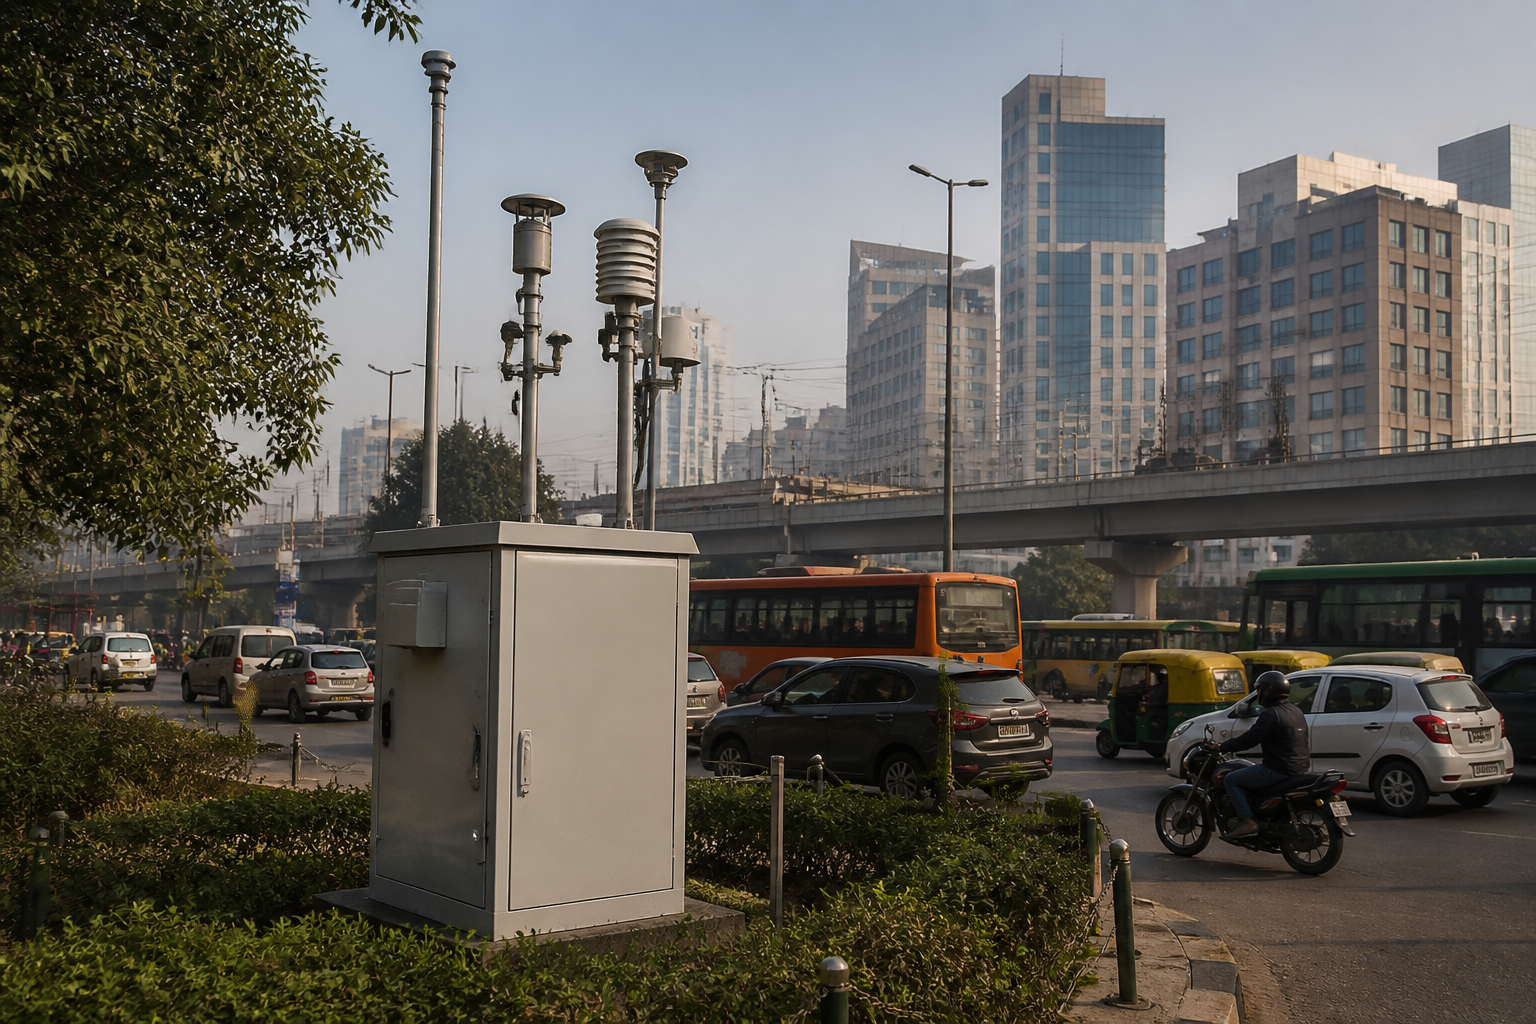
Delhi’s average September AQI fell to 102 in 2026, the lowest September average recorded in the five-year comparison published by the Times of India. The improvement is modest in numerical terms, but the broader data released by the Commission for Air Quality Management (CAQM) points to a more significant shift: Delhi recorded 194 days with a daily average AQI below 200 between January and September 2026, the highest count for that period in the five-year comparison.
The figures do not establish that Delhi’s air-quality problem has been solved. They do show that the city’s pollution record is being measured against a longer trend rather than a single good month. That distinction matters in a city where air quality is often discussed through short-lived peaks during severe pollution episodes. The CAQM data, as reported, offers a different lens: how frequently the city remains below the AQI threshold of 200 over a sustained period.
In September, Delhi’s monthly average AQI was 102, compared with 105 in both 2025 and 2024, 108 in 2023 and 104 in 2022. The difference between 102 and 108 is not dramatic, but it places 2026 at the most favourable end of the reported five-year series. The comparison also shows that the improvement is not a straight-line trend. The 2025 and 2024 averages were identical, while 2022 recorded a September average of 104, better than the two intervening years but worse than 2026.
That pattern makes the September figure useful but limited. A monthly average compresses daily variation into one number. It can show the general level of pollution over the month, but it does not reveal how many days were cleaner or worse than the average, which pollutants were responsible, or whether particular neighbourhoods experienced the same conditions. None of those details is provided in the reported data. The September result should therefore be read as evidence of an improvement in the monthly average, not as a complete account of Delhi’s air quality.
The second measure supplied by CAQM is more revealing about continuity. From January to September, Delhi recorded 194 days with a daily average AQI below 200 in 2026. The corresponding figures were 187 days in 2025, 188 in 2024, 193 in 2023 and 146 in 2022. Since the comparison covers the same nine-month period, the figures indicate that 2026 had the highest number of days in the reported five-year series in the moderate range below 200.
The gap between 194 days in 2026 and 146 days in 2022 is 48 days. Compared with 2025, the increase is seven days; compared with 2024, it is six days; and compared with 2023, it is one day. This is not evidence of a transformation on its own, but it does suggest that the improvement was not confined to September. The measure indicates more days below the 200 mark during the first nine months of the year than in any of the previous four years included in the comparison.
At the same time, the data needs to be interpreted carefully. AQI is a combined index, and a daily average below 200 does not mean that pollution is absent or that exposure is uniform across the city. The source report describes days below 200 as moderate, but it does not provide pollutant-wise readings, station-level data, health indicators or information on the number of days in each lower AQI band. It also does not explain which factors contributed to the year-on-year change. Those limitations prevent the figures from being used to attribute the improvement to any single policy, agency or intervention.
This is where the institutional role of CAQM becomes important. The commission said it is working closely with stakeholders on measures for the prevention, control and abatement of air pollution and to improve air quality in Delhi-NCR. The statement identifies a coordination-based approach, but the supplied report does not list the specific measures, participating agencies, compliance outcomes or funding arrangements involved.
Air pollution management in the capital region is therefore visible in the data as an administrative challenge, even when the operational details are not. Delhi’s air does not stop at municipal boundaries, and the reference to Delhi-NCR places the problem within a wider regional framework. CAQM’s stated role in coordinating with stakeholders reflects that institutional geography. However, the report does not specify how responsibilities are divided between the commission, local governments and other authorities, nor does it identify which actions delivered measurable results in 2026.
The five-year comparison also shows why a single favourable number should not become the only measure of performance. In September, the difference between the best and worst monthly averages in the series is six AQI points: 102 in 2026 compared with 108 in 2023. For the January-to-September measure, the range is much wider, from 146 days below AQI 200 in 2022 to 194 days in 2026. The two indicators are related but not interchangeable. One captures a monthly average; the other counts days meeting a defined threshold.
That distinction has practical importance for residents. A lower monthly average may indicate generally improved conditions, while a higher number of days below 200 suggests fewer days crossing that threshold. Neither measure shows whether pollution spikes were concentrated in particular periods or locations. Residents living near major roads, construction activity or other emission sources may not experience the citywide average in the same way, but the supplied report does not contain localised observations that would allow those differences to be assessed.
The available evidence also does not establish whether the 2026 improvement will continue through the rest of the year. The figures cover January to September, while the report specifically highlights September’s monthly average. The remaining months are not discussed, and no forecast or projection is provided. Any assessment of the full-year outcome would therefore go beyond the evidence currently available.
What the data does establish is narrower and more useful. Delhi’s September 2026 average AQI was the lowest in the five-year comparison cited by the report. The city also had the highest number of days below AQI 200 during January-September among the five years listed. These are measurable improvements against the selected indicators, but they do not by themselves identify the causes, the distribution of benefits across neighbourhoods or the effect on public health.
For urban governance, the next question is whether the administration can connect citywide outcomes to specific interventions and publish enough detail to assess them. CAQM has said that it is working with stakeholders on pollution prevention, control and abatement. The evidence supplied here confirms the commission’s stated direction, but not the performance of individual measures. A stronger assessment would require pollutant-specific data, station-level comparisons, agency-wise actions and a longer time series.
Delhi’s latest AQI figures therefore represent progress without closing the argument over air quality. They show a better September average and more days below AQI 200 than in the previous four-year comparisons. They do not yet explain why the improvement occurred or whether it is evenly experienced across the region. The next significant evidence will be the remaining 2026 data and fuller disclosure of the measures CAQM and its stakeholder agencies say they are implementing.
