


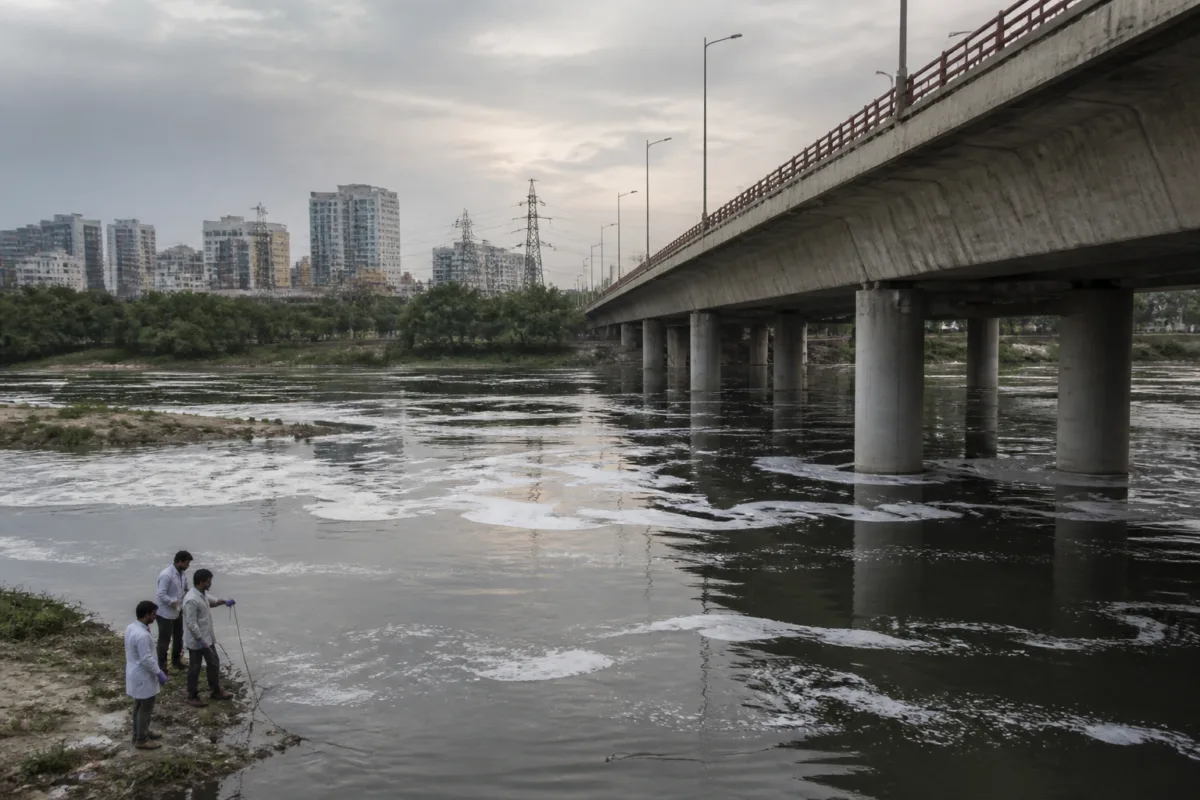
The latest Yamuna pollution data cited from a Delhi Pollution Control Board report show that contamination is not evenly distributed across Delhi’s river stretch. The highest biochemical oxygen demand was recorded at the ISBT bridge, while Asgarpur recorded the highest faecal coliform level among the monitoring points listed in the report. Together, the figures show how different indicators identify different kinds of pressure on the river.
The data were reported by Live Hindustan – NCR in a story published on November 14, 2026. The report said the DPCC report was published on September 30, 2026, and that samples from different points on the Yamuna had been collected on September 7. The findings have acquired renewed public attention amid political allegations over dead fish and chemical contamination during the Chhath period, but the monitoring figures offer a more measurable way to understand the river’s condition.
The central finding is stark: all five locations listed in the report recorded biochemical oxygen demand far above the stated bathing-water benchmark of 3 milligrams per litre. BOD was recorded at 30 milligrams per litre at the ISBT bridge, 18 at the ITO bridge, 16 at Asgarpur, 12 at the Nizamuddin bridge and 10 at the Okhla barrage.
BOD measures the amount of oxygen used by bacteria to break down organic matter in water. A higher value indicates a greater load of biodegradable organic pollution. In practical terms, the BOD readings suggest that the river is receiving or retaining substantial organic waste at each of the monitored points, although the figures alone do not identify the precise source of that waste.
The variation between locations is also important. The ISBT bridge reading was nearly twice the level recorded at Okhla barrage and 10 times the stated bathing-water benchmark. This does not mean that one monitoring point represents the entire river. It shows instead that pollution conditions can differ substantially along the same urban waterway, making location-specific monitoring essential for understanding where contamination is most intense.
Faecal coliform readings provide a second view of the problem. These bacteria are used as an indicator of pollution associated with human and animal excreta. The report cited a maximum permissible level of 2,500 MPN per 100 millilitres for bathing water. At Asgarpur, the level was recorded at 38,000 MPN per 100 millilitres, or 15.2 times the stated limit. The ISBT bridge recorded 35,000, followed by Okhla barrage at 21,000, the ITO bridge at 17,000 and the Nizamuddin bridge at 15,000.
The ranking changes when the indicator changes. ISBT had the highest BOD in the figures reported, while Asgarpur had the highest faecal coliform level. This distinction matters because a single headline measure cannot describe the complete condition of a river. BOD points to oxygen demand created by organic matter, faecal coliform indicates contamination associated with excreta, and dissolved oxygen shows how much oxygen remains available in the water for aquatic organisms.
The reported faecal coliform values were several times above the stated benchmark at every listed location. Asgarpur’s figure was the most elevated, but the other sites also recorded substantial exceedances. The data therefore describe a problem that is distributed across the monitored stretch, even though its intensity differs from site to site.
Dissolved oxygen adds a further layer to the assessment. The report said that at some monitoring stations, dissolved oxygen was below the stated standard of 5 milligrams per litre. Dissolved oxygen is important for fish and other aquatic organisms. When its concentration falls, the ability of aquatic life to survive can come under pressure. However, the report did not provide the individual dissolved oxygen readings for each of the five locations, so it is not possible from the supplied figures to rank those sites on this measure.
That limitation is significant. The available data establish that some stations had dissolved oxygen below the cited standard, but they do not show the size, duration or exact location of every shortfall. Similarly, the BOD and faecal coliform figures are measurements from samples collected on September 7 rather than a continuous record of daily river conditions. They provide a snapshot of the river at specific points and a specific time.
This is why the institutional role of monitoring agencies is central to interpreting the Yamuna’s condition. The DPCC report, as cited in the article, converts a politically contested issue into comparable measurements from named locations. It also makes clear that river pollution cannot be assessed only by visual appearance or isolated incidents. The indicators track different aspects of water quality and need to be read together.
The political dispute mentioned in the report illustrates the difficulty of separating an immediate incident from the underlying river condition. A cabinet minister, Pravesh Verma, was reported to have alleged that the Aam Aadmi Party had placed dead fish in the Yamuna. The AAP was reported to have argued that the fish died because chemicals had entered the river. The supplied report does not independently establish either allegation. The DPCC figures, however, document high levels of pollution through water-quality indicators regardless of the claims exchanged by political parties.
The geographic spread of the readings also raises a governance question. The five monitoring points cover locations from the ISBT bridge and ITO bridge to Asgarpur, Nizamuddin bridge and Okhla barrage. These are not interchangeable sites. A river passing through a dense metropolitan area can experience changing conditions as it moves past bridges, drains, settlements, infrastructure and other urban activities. The reported differences show why interventions and accountability cannot rely only on an average figure for the entire Delhi stretch.
At the same time, the supplied material does not identify the drains, treatment facilities, discharge points or agencies responsible for the specific readings at each location. It also does not provide a time series comparing September 7 with earlier or later sampling dates. Without those details, the report can establish the severity and variation of contamination but cannot establish which source contributed how much at any individual site.
The most useful conclusion from the data is therefore not that one location alone is responsible for the Yamuna’s condition. It is that the river is failing multiple water-quality tests across the listed monitoring points, while the pattern varies by indicator. The BOD readings show high organic pollution across all five sites. The faecal coliform readings show widespread contamination associated with excreta. The dissolved oxygen information indicates additional stress for aquatic life at some stations.
For citizens, the figures are a warning against treating the river’s pollution as a purely seasonal or political issue. The measurements were collected in September and reported later, while public attention intensified around Chhath. That timing shows how visible public debate can rise and fall even when the underlying monitoring record comes from an earlier period. The river’s condition has to be understood through regular sampling rather than only through festival-season controversy or isolated visual events.
For urban administration, the data point to the need for continued location-specific disclosure. The report identifies where samples were taken and what the readings were, but the available account does not include the full DPCC dataset, the number of samples at each site, weather or flow conditions, or a longer trend line. Those details would help distinguish persistent hotspots from short-term variations and connect measurements to corrective action.
The evidence currently confirms a serious pollution burden at the five reported locations, with ISBT registering the highest BOD and Asgarpur the highest faecal coliform level. It also confirms that some monitoring stations recorded dissolved oxygen below the stated standard. What remains unclear from the supplied material is the precise source of pollution, the duration of the recorded conditions and whether the readings have improved or worsened since the September sampling. Those are the next questions that future DPCC monitoring and public reporting will need to answer.