


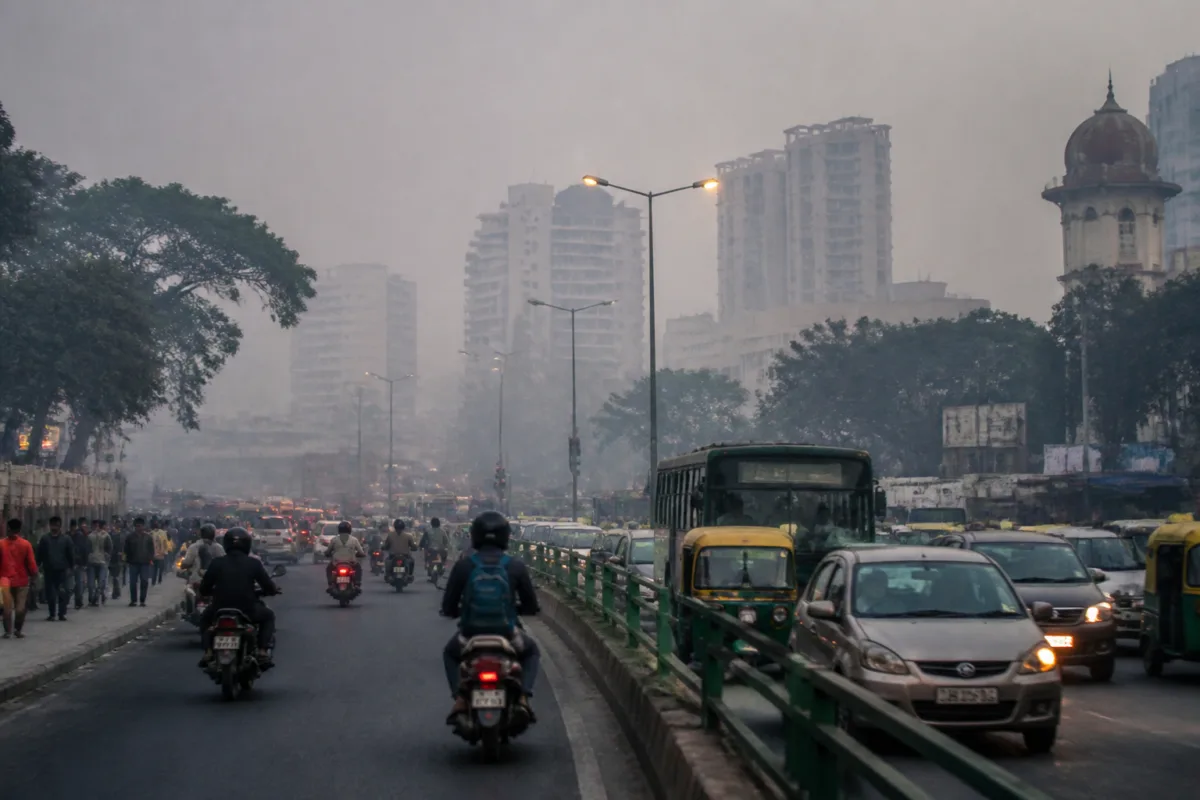
Bengaluru’s air pollution rose sharply during Diwali 2026, reversing the improvement recorded in 2025 and exposing a wider urban problem: pollution controls remain dependent on weather, public compliance and the timely release of information. Data cited in a report by Prajavani showed an average Air Quality Index (AQI) of 114.33 during the festival period, while several dense and high-traffic parts of the city recorded readings above 180.
The change was particularly stark against the previous year. During Diwali in 2025, Bengaluru’s air pollution had fallen by 30.34 per cent compared with 2020 and the preceding year, according to the report. The 2025 level was also 44 per cent lower than in 2024. In 2026, however, pollution increased by 37 per cent compared with the previous year.
The figures show how quickly annual pollution gains can be reversed. They also underline the limits of treating festival pollution as an isolated episode. Firecracker emissions are released over a short period, but their effects are shaped by the city’s built form, traffic intensity, weather conditions and the ability of regulators to enforce restrictions across multiple neighbourhoods.
The report cited an AQI reading of 53 on November 7, the day before Diwali. It rose to 102 on November 8, the first day of the festival, before reaching 144 on November 9 and 133 on November 10. The report described the average as 114.33 for three days, while also listing readings for four dates. That discrepancy does not alter the direction of the trend, but it shows why clearly published station-wise and date-wise data is important when authorities communicate pollution levels.
Majestic, one of Bengaluru’s busiest transport and commercial zones, recorded the highest reported AQI during the festival period at 228. Kadu Beesanahalli on the Outer Ring Road recorded 188. Koramangala and Richmond Town recorded 186, while Electronic City, Neeladri Nagar and areas around Silk Board recorded 181. Whitefield and Kundalahalli recorded 182. Higher pollution was also reported around the western gate of Lalbagh and in parts of Jayanagar.
These locations are not uniform in their urban character. Majestic is a major railway and transit district with intense pedestrian and vehicular movement. Kadu Beesanahalli, Silk Board, Electronic City, Whitefield and Kundalahalli are associated with major employment corridors and heavy daily commuting. Koramangala, Richmond Town and Jayanagar combine dense residential, commercial and road activity. The spread of high readings across these different areas suggests that festival pollution was not confined to one localised pocket.
The locations also show why city-level averages can conceal ground-level exposure. A citywide figure may describe the general trend, but the experience of residents depends on where they live, work, travel or spend time during the festival. A reading of 228 around Majestic and readings above 180 in several other areas indicate that the public-health burden was unevenly distributed across Bengaluru’s urban network.
Noise pollution followed a similar pattern. The report said the average level increased by 62 per cent compared with 2025, rising from 74 decibels to 122 decibels. The reported standard limit was 50 decibels. Higher noise levels were recorded around Ramamurthy Nagar, Koramangala, Yelahanka, HSR Layout, Indiranagar, Jayanagar, the RVCE–Mysuru Road corridor, BTM Layout and Domlur.
The noise data adds another layer to the episode. Air pollution is often measured through monitoring stations and discussed through AQI categories, while noise is experienced directly through residential streets, commercial areas and transport corridors. A reported average of 122 decibels, more than twice the stated 50-decibel standard, points to a substantial breach of the intended control framework. The information supplied in the report does not specify whether the noise measurements were taken continuously, at fixed monitoring stations or during peak firecracker periods. That methodological detail matters for comparing readings across years.
Weather played an important role in the contrast between the two years, according to Forest and Environment Minister Ramalinga Reddy. He said Bengaluru received heavy rain during Diwali in 2025 and fewer people burst firecrackers, which contributed to lower pollution. In 2026, he said, there was no rain and residents burst more firecrackers.
This explanation illustrates the dependence of festival pollution outcomes on conditions that are only partly controlled by government. Rain can suppress or disperse particulate pollution, while dry conditions can allow smoke to remain more visible and concentrated. But weather does not explain the whole governance challenge. The minister also said that people had not followed the restriction allowing green firecrackers only during specified hours.
The permitted period was reportedly 8 pm to 10 pm. The minister said residents did not comply with the timing restriction. This places enforcement at the centre of the issue. A rule is unlikely to reduce pollution meaningfully if compliance is assessed only through general appeals, especially in a large city where firecrackers are used across thousands of streets and housing clusters.
The report also raised concerns about the availability of official information. It said the Karnataka State Pollution Control Board did not share data and reports related to Diwali and the days preceding it when contacted by the publication. Officials reportedly said that no report on air or noise pollution had been prepared and that information available online could be used. Another official was quoted as saying that the data was ready but senior officials had instructed staff not to share it.
That reported gap is significant because pollution data performs two functions. It informs residents about immediate exposure and allows the public to evaluate whether restrictions worked. It also enables the administration to compare one year with another and identify locations requiring targeted action. If information is released only after considerable delay, it becomes harder to assess compliance, enforcement and the effect of weather conditions while the event is still fresh.
The institutional responsibility is divided. The Karnataka State Pollution Control Board is the authority directly associated with monitoring and reporting air and noise pollution. The state’s Forest and Environment Department is responsible for the broader policy and public communication context. Residents, meanwhile, are expected to follow the permitted time window and restrictions on the type of firecrackers used. The festival therefore becomes a test of coordination between regulation, monitoring, enforcement and public behaviour.
The evidence supplied in the report does not establish how many monitoring stations contributed to the AQI average, whether the same stations were used in 2025 and 2026, or how the 37 per cent increase was calculated. It also does not provide pollutant-specific readings, such as particulate matter concentrations, or explain the basis of the noise measurements. Those omissions limit the extent to which the figures can be used for a precise year-on-year performance assessment.
Even with those limitations, the available numbers establish a clear pattern. Bengaluru moved from a reported reduction in Diwali pollution in 2025 to a substantial increase in 2026. The reversal was visible in both air and noise readings, occurred across multiple urban districts and coincided with dry weather, heavier firecracker use and reported non-compliance with the two-hour restriction.
The larger urban question is whether festival pollution is being managed as a recurring administrative exercise or as part of a wider citywide environmental monitoring system. The locations listed in the report include transport hubs, technology and employment corridors, mixed-use neighbourhoods and established residential districts. That spread means the issue intersects with everyday mobility, housing density, public health and neighbourhood governance rather than remaining limited to a single celebration.
The 2026 episode also demonstrates why annual comparisons require consistent and transparent measurement. Without clearly published station locations, monitoring methods, pollutant breakdowns and time periods, residents can see the direction of change but cannot fully examine its causes. That weakens accountability even when the reported trend is unmistakable.
What the evidence confirms is a sharp deterioration from the lower pollution levels reported during Diwali 2025, alongside elevated noise across several Bengaluru neighbourhoods. What remains unclear is the precise monitoring methodology, the full official dataset and the extent of enforcement against restricted hours and firecracker rules. The next important development is the public release of complete air and noise data by monitoring location and date, along with the Karnataka State Pollution Control Board’s explanation of the reported figures.