


Swiggy’s Instamart is growing, but its latest operating figures show that growth alone is not closing the gap with Blinkit. In the July-September quarter, Instamart’s net order value rose 34.8 per cent year on year to ₹6,594 crore, yet its adjusted EBITDA loss widened to ₹895 crore. Blinkit, by contrast, reported a net order value of ₹20,940 crore and adjusted EBITDA of ₹184 crore. The contrast makes Instamart versus Blinkit less a contest over order volumes than a test of whether quick-commerce networks can convert physical reach into sustainable urban operating economics.
The gap is visible in the scale of the two businesses. Blinkit’s order value was more than three times Instamart’s during the quarter, while its network of 2,751 dark stores was more than twice the size of Instamart’s 1,240 stores. Blinkit added 308 net stores during the period, compared with 69 added by Instamart. These figures, reported in The Hindu BusinessLine’s account of the companies’ results, point to two different positions in the same market: one company is expanding from a larger base while improving margins, while the other is still investing to build network density, assortment and service quality.
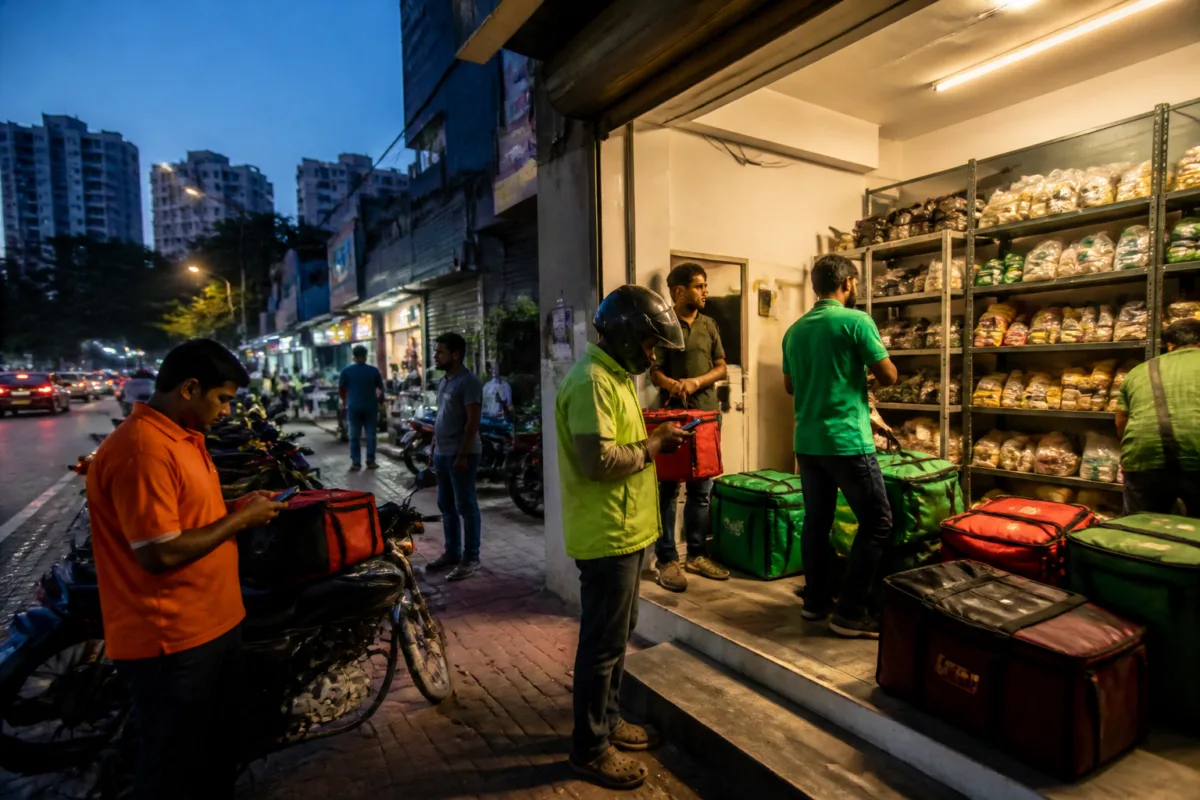
That distinction matters because a dark-store network is not merely a digital retail asset. It is a physical urban system consisting of small fulfilment locations, inventory, workers, delivery routes and local demand. The commercial logic depends on placing enough inventory close enough to customers to support rapid delivery, while generating sufficient order volume at each location to cover operating costs. The supplied results do not provide store-level profitability or a city-by-city breakdown, but the contrasting store counts and expansion rates show the scale of the infrastructure challenge facing Instamart.
Instamart’s growth indicators are not weak in isolation. Its orders increased 29.3 per cent year on year to 130 million, while monthly transacting users rose 23 per cent to 14.8 million. Sequential net order value growth accelerated to 13.4 per cent from 2.5 per cent in the preceding quarter. These numbers indicate that the platform is adding demand and customers. The difficulty is that the improvement in demand has not yet translated into a narrower reported profitability gap.
Instamart’s adjusted EBITDA loss increased from ₹849 crore a year earlier and ₹778 crore in the June quarter to ₹895 crore in the July-September quarter. Its contribution margin stood at minus 1 per cent of gross order value. The figures suggest that the immediate issue is not simply whether customers are using the service, but whether each additional order and each new store improves the economics of the network. The source attributes this challenge to the need to improve store productivity, retention, assortment and product availability as the business scales.
Blinkit’s reported position is materially different. Its adjusted EBITDA was ₹184 crore, and its adjusted EBITDA margin improved for the sixth consecutive quarter to 0.9 per cent of net order value. The company also added 308 net stores in the quarter. The supplied evidence does not establish that Blinkit’s model can be replicated directly by competitors, but it does show that scale and margin performance are moving together for the market leader, while Instamart is still carrying a larger reported loss despite expanding its own order base.
The resulting strategic question is whether Instamart should pursue the same expansion path or improve the productivity of its existing network first. Swiggy added 69 stores in the quarter and invested in assortment, product availability and service quality. That approach indicates a focus on strengthening the platform’s existing operating base rather than matching Blinkit store for store in the same period. However, the difference in additions also underlines the challenge: a slower expansion rate may limit reach, while a faster one could increase the cost burden before individual locations become productive.
Swiggy is also seeking to improve the composition of each basket. Its Switch proposition brings together partnerships with around 400 brands, while its private-label No!ce and fresh-produce brand Nectr are intended to create differentiated products and potentially improve the value captured from transactions. According to the company, No!ce appears in one in eight baskets, and customers buying the brand show 15 percentage points higher retention. These are company-reported indicators, but they identify the mechanism Swiggy is relying on: stronger retention and a more distinctive assortment could increase repeat usage without depending only on adding stores or discounting for volume.
The planned shift to inventory ownership is another important change in the operating model. The transition is expected to begin in mid-Q3 FY27 and take two to three quarters to complete. Swiggy expects the change to add about 80 basis points to Instamart’s contribution margin once fully rolled out. The supplied material does not detail the capital, working-capital or operational implications of owning inventory, so the margin benefit should be treated as management’s expectation rather than an established outcome. What is clear is that Swiggy sees control over inventory and assortment as central to improving the economics of its quick-commerce business.
This has an urban dimension because the competition is being fought through distributed physical networks rather than only through apps. The location, density and utilisation of dark stores determine how quickly orders can be assembled and delivered. Store expansion therefore affects the organisation of last-mile retail within neighbourhoods, even though the available figures do not specify the land-use, traffic or employment effects in individual cities. The results do, however, show how a digital service can generate a substantial physical expansion requirement: Instamart had 1,240 stores, while Blinkit had 2,751, and both continued to add locations.
The institutional and commercial structure remains company-led. The source describes Swiggy’s investments, brands, store network and planned inventory transition, while Blinkit’s figures are reported through Eternal’s quick-commerce business. No government scheme, municipal policy, public funding arrangement or regulatory intervention is identified in the supplied material. The principal governance question visible in the data is therefore internal to the platforms: how companies allocate capital, organise fulfilment and balance customer service against store-level and order-level returns.
The quarter’s numbers also complicate the idea that faster growth automatically produces better economics. Instamart’s net order value grew 34.8 per cent year on year and its monthly transacting users rose 23 per cent, but its adjusted EBITDA loss widened. Blinkit’s net order value grew 79.3 per cent and its adjusted EBITDA reached ₹184 crore. The comparison does not prove that scale alone caused Blinkit’s profitability, because the supplied report does not provide a full breakdown of pricing, costs, revenue mix or store productivity. It does show that the two businesses are at different stages of network development and financial performance.
For urban consumers, the immediate experience is likely to be shaped by availability, delivery reliability, assortment and the presence of competing platforms. For the companies, the underlying contest is more demanding: every new fulfilment point must support a service proposition while contributing to a network that can absorb operating costs. The source provides no independent consumer survey or city-level service data, so it cannot establish which platform offers better service across locations. It can establish that Swiggy’s stated response is to combine continued sequential growth with better store productivity, differentiated products, stronger retention and a new inventory model.
Instamart versus Blinkit is therefore not only a race for order value. It is a comparison between a larger, profitable and rapidly expanding network and a smaller network that is growing but still reporting widening losses. The next evidence will come from whether Instamart can improve its contribution margin, whether the planned inventory transition delivers the projected 80-basis-point benefit, and whether management’s expectation of continued sequential growth and operating-margin improvement is reflected in subsequent results. Until then, the reported figures show that closing the scale gap will require more than adding customers: it will require making the physical network work harder and more profitably.